Reductio →
Crossfilter has played a pretty big part in my work for the last couple of years. For those who don't know, Crossfilter is a Javascript library that "supports extremely fast (<30ms) interaction with coordinated views, even with datasets containing a million or more records" in the web browser. It is designed for use in visualizations and applications that allow interaction with and filtering of multiple dimensions of a single data set.
I've found Crossfilter to be a very powerful tool for building applications that support data interactions that feel 'real-time'. The idea is that <100ms interactions are fast enough to allow us to identify patterns and correlations as the visualization changes in exact coordination with our filtering. I use Crossfilter in several places, but the biggest project is easily Palladio, which is a testbed platform for research activities and a powerful example of the possibilities of browser-based data exploration tools.
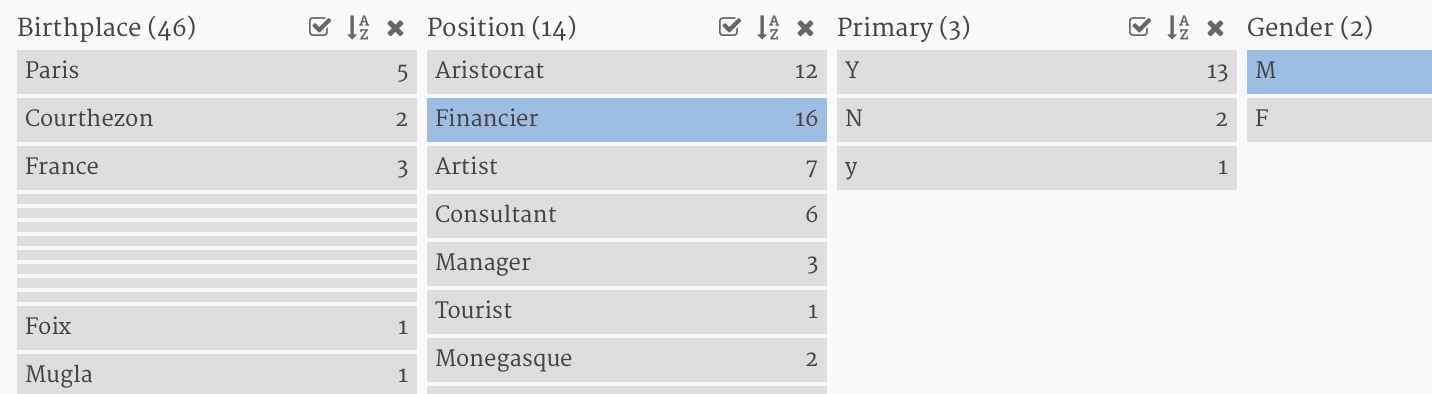
Faceted browsing in Palladio - driven by Crossfilter and Reductio
Crossfilter consistently trips up people trying to use it for the first time because, I believe, its programming model for aggregations is inconsistent with the model we usually expect. It's for this reason that I started Reductio, a library that helps build up aggregation functions that work correctly and efficiently with Crossfilter's model.
I'm not going to get into all of the details here, but defining aggregations in Crossfilter requires defining functions that incrementally update the aggregation based on the addition or removal of records. This is at odds with the standard way of computing aggregations by building them up from scratch that we see in SQL or more standard map-reduce models.*
// A function that can be passed to Array.reduce to sum the array
function(a, b) {
  return a + b;
}
// The equivalent operation in Crossfilter requires 3 functions
function reduceAdd(p, v) {
  return p + v.total;
}

function reduceRemove(p, v) {
  return p - v.total;
}

function reduceInitial() {
  return 0;
}
It's these aggregation functions that consistently trip people up. The summation case is simple enough because summation is an operation that is computationally equivalent given the running total and the value to be added or removed. But what about operations that are not reversible? Take the computation of a maximum. When adding a new record to a maximum aggregation, we just need to check if the value of the record is larger than the current largest value we've seen (the current maximum).
// A function that can be passed to Array.reduce to return the max
function (a, b) {
  return Math.max(a, b);
}
But if we remove a record with a value equal to the current maximum, we need to know the next smallest value. And if we remove the record with that value we need to know the next smallest, and so on. We have to keep track of all values seen in order to avoid needing to rebuild the entire aggregation from scratch when a record is removed. And yes, this is significantly faster than rebuilding from scratch!
// The equivalent operation in Crossfilter (optimized, with
// error guards). Adapted from Reductio
var bisect = crossfilter.bisect.by(function(d) { return d; }).left;

function reduceAdd(p, v) {
    i = bisect(p.values, v.number, 0, p.values.length);
    p.values.splice(i, 0, v.number);
    p.max = p.values[p.values.length - 1];
    return p;
}

function reduceRemove(p, v) {
    i = bisect(p.values, v.number, 0, p.values.length);
    p.values.splice(i, 1);

    // Check for undefined.
    if(p.values.length === 0) {
        p.max = undefined;
        return p;
    }

    p.max = p.values[p.values.length - 1];
    return p;
}

function reduceInitial() {
  return { values: [], max: 0 };
}
It's a lot of work to come up with these aggregation functions, make them efficient, and test them thoroughly, and Crossfilter beginners (myself included) consistently struggle with this. Believe it or not, things get even nastier when dealing with thing like pivot- or exception-aggregations, when building aggregations where a record counts in more than one aggregation group (like moving averages, or tags), or when trying to compose multiple aggregations (commonly required for visualizations as simple as a scatter-plot). Reductio supports all of these aggregations and a few more, and I hope it will allow a quicker, smoother start when using Crossfilter.
* This difference in model is to allow very fast interactions with data and aggregations. If you aren't building an application that requires real-time interactions and are thinking about using Crossfilter simply to do one-time calculations or aggregations on your data, think again about using Crossfilter as it is probably not the right tool for the job.
