Musing about semantics in BI

Recently I've been blogging mostly about SAP's new HANA product and the general in-memory approach. My deeper professional focus is a little further from the metal, in datawarehousing, business intelligence, and planning processes and architectures. Some recent emails, tweets, and discussions have prompted me to get back to my roots ... but roots are hidden and hard to conceptualize. So I brought diagrams!

One of the hard problems in datawarehousing and business intelligence is semantics, or meaning. We need to integrate the semantics in user requirements with the semantics of the underlying systems. We need to integrate the semantics of underlying systems with each other. And we need to integrate the semantics of a system with itself!

That wasn't very clear. Here's an example: Revenue.

Simple right? Not so fast!

Our users want a revenue report. When our finance users say revenue, they might mean the price on the invoice, without any discounts. But our ERP system may display revenue as a number that includes certain types of discounts. (This is the problem of integrating user's semantics with system semantics.) And our other ERP system may include a different mix of discounts in the revenue number. (The problem of integrating the semantics of underlying systems with each other.) Meanwhile, a single SAP ERP system will record revenue from a sales in several different places: On the invoice, in the G/L, maybe in a CO-PA document. Each of these records is going to have a different semantics and it's quite possible that it is difficult to derive the number the system displays to us from the data in the underlying tables. (The challenge of integrating the semantics of systems with themselves.)

Wow! That's just the first line of the P&L statement!

This example is a little contrived, but it's not too far from the truth. At this point, I just want to recognize that this is a tough problem and we really don't have a very good solution to it aside from the application of large amounts of effort. The interesting question to me right now is where this effort is already embedded into our systems (so we don't have to expend as much effort in our implementations) and what affect SAP's new analytics architectures might have in this area.

I promised diagrams and musing, so here we go. I want to talk a little bit about layering semantic representations on top of ERP data models, which tend to be highly optimized for performance and therefore quite semantically opaque. In order to think more clearly about the different ways of doing this and the trade-offs involved, I cooked up some pictures. We'll start simple and move on to more complex architectures.

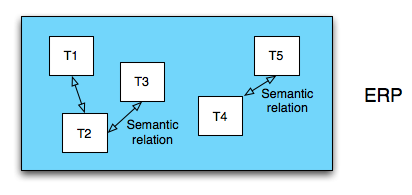
This is a naive model of an ERP system. It's got a lot of tables: 5 (multiply by at least 1000 for a real ERP system). These tables have a lot of semantic relationships between themselves that the ERP system keeps track of. It knows which tables hold document headers and which tables hold the line items for those documents. It knows about all the customers, and the current addresses of those customers, and it knows how to do the temporal join to figure out what the addresses of all our customers was in the middle of last year. I don't have much more to say about this. It just is how it is: Complicated

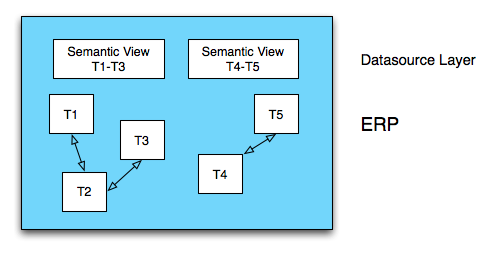
This is an ERP system that has semantic views built into it. These views turn the underlying tables into something that makes sense to us - we might call them views of business objects. Maybe the first view is all of those customers with start and end dates for each address. And the second view might be our G/L entries with line item information properly joined to document header information.

Interestingly, creating semantic views like this is almost exactly what BW business content extractors do. These extractors have been built up over more than a decade of development. They were built by the application teams, so if anyone knows how the application tables are supposed to fit together, it's the people who built these extractors. There is a lot not to like about various business content extractors but we can't deny the huge amount of semantic knowledge and integration work embedded in these tools.

Other tools, like the BusinessObjects Rapidmart solutions also know how to create semantic views of underlying ERP tables, though Rapidmarts accomplish this in a slightly different way. There is a lot of knowledge and work embedded in these solutions as well.

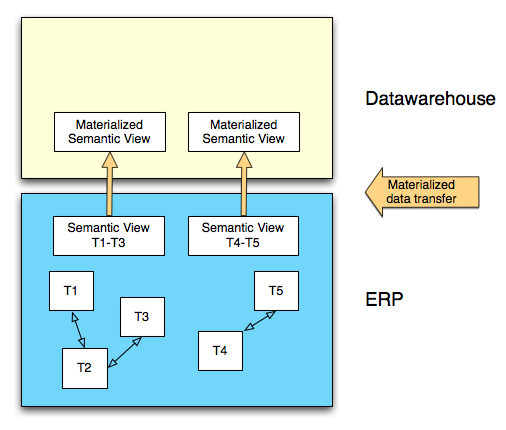
When we use the business content extractors with BW, we move the semantic view that the ERP system creates into a structure in the datawarehouse. As long as you use the business content extractors you don't need to worry much about the ERP data models. This diagram shows a fairly traditional datawarehousing approach. The same sort of thing happens with other solutions based on semantic representations of ERP data.

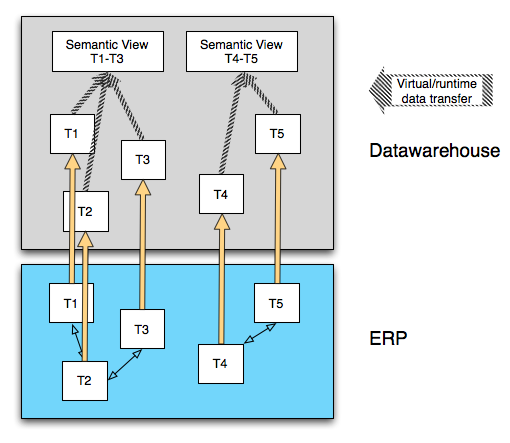
Another option is to directly replicate our ERP tables into an analytic layer. This is what happens in the case of SAP HANA if you are using Sybase Replication Server to load data into HANA. Notice the virtual semantic views that are created in the datawarehouse system. This work must be done for most ERP data structures, because as we've already discussed, these ERP data structures don't necessarily make any sense on their own. Creating these views is one thing we have been hearing from Vitaliy Rudnytskiy that IC Studio will be used for. Ingo Hilgefort touches on some of the same points in his blog on the HANA architecture. And Brian Wood also briefly touches on his role in developing semantic views for ERP data in HANA in his TechEd 2010 presentation.

I find that there are two interesting things about this approach, and these are things to watch out for if you are implementing a system like this:

First, whereas the semantic views in the previous diagram are materialized (meaning pre-calculated), these views are not, meaning that they need to be calculated at query run-time. Even on a system as blazing fast as HANA, I can see the possibility of this turning into a problem for certain types of joins. No matter how fast you are going, some things just take time. Vitaliy, again, does a great job of discussing this in his comment on Arun's blog musing on the disruption that HANA may cause to the datawarehousing space: http://www.sdn.sap.com/irj/scn/weblogs?blog=/pub/wlg/22570.

The second musing I have is that until SAP or partners start releasing semantic integration content, each customer or systems integrator is going to need to come up with their own strategy for building these semantic views. In some cases this is trivial and it's going to be tough to get wrong, but in a lot of cases the semantics of ERP tables are extremely complex and there will be lots of mistakes made. It is going to take a while for semantic content to reach a usable level, and it will take years and years for it to reach the level of the current business content extractors. Customers who are used to using these extractors with their BW installations should take note of this additional effort.

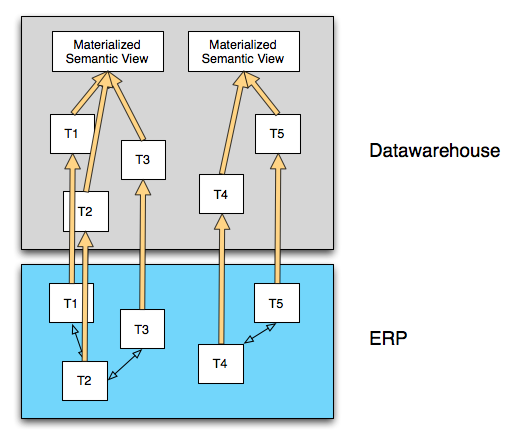
The solution to semantic views that are too processing intensive to run in the context of a query is to materialize the view. It is unclear to me whether or not you can use IC Studio to do this in HANA. At worst you can use BusinessObjects Data Integrator to stage data into a materialized semantic view, then query on this view in HANA. Of course, now we are storing data twice in HANA, and these blades aren't exactly cheap!

When we do this, using the tools currently available to us in HANA, we also lose the concept of real time. This is because our ETL process is no longer only a push process using Sybase Replication Server; now there is also a batch ETL process that populates the materialized view. We are back in the same trade-off between load-time complexity and query-time complexity that we face and struggle with in any BI system.

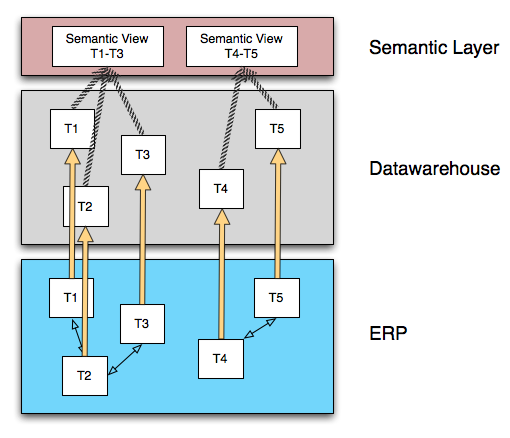
One possible solution to the second problem mentioned above (the difficulty of building semantic views on very complex and heterogeneous data models), is for SAP and partners to deliver semantic integration logic in a specialized semantic unification layer. We might call this layer the Semantic Layer, which Jon Reed, Vijay Vijayasankar, and Greg Myers discuss very insightfully in this podcast: http://www.jonerp.com/content/view/380/33/. I suspect that this layer will be a central piece in the strategy to address the semantic integration problem that is introduced when we bypass the business content extractors or source datawarehouse structures from non-SAP systems.

This is even possible across source systems in BusinessObjects 4.0 with the use of Universes that support multiple sources, a feature that is new to this release. It is a very powerful idea and I really look forward to seeing what SAP, customers, and partners build on this new platform.

But I'm a little worried about this approach in the context of higher-volume data, and the reason is those stripped arrows crossing the gap between the datawarehouse system and the semantic layer system. If you look back at the previous diagrams, the initial semantic view is always in the same physical system as the tables that the semantic view is based on. Except in the last diagram. In this diagram the semantic view is built on a different platform than the data is stored in.

What does this mean? It means for certain types of view logic, we are going to be in one of two situations: Either we are going to need to transfer the entire contents of all tables that feed the view into the semantic layer, or we are going to need to do large numbers of round-trip queries between the semantic layer and the datawarehouse layer as the semantic layer works to incrementally build up the view requested by the query. Either of these integration patterns is very difficult to manage from a performance perspective, especially when the integration is over a network between two separate systems.

There are ways around this, including (re)introducing the ability to easily move semantically integrated data from an ERP system into a hypothetical future HANA datawarehouse, or tight integration of the semantic layer and the datawarehouse layer that allows the logic in the semantic layer to be pushed down into the datawarehouse layer.

I wonder if we'll see one or both of these approaches soon. Or maybe something different and even better!

Thoughts on what's next for Apache ESME

I'm a committer on the Apache Enterprise Social Messaging Environment (Apache ESME). At least I think that's what it stands for today. We sort of looked at SAP's approach where the acronym for a product changes every year or so and we maybe went a little too far in the opposite direction, refusing to change the acronym even when we need to change the name - teen vampire romances be damned!

In any case, ESME takes a lot of its cues from Twitter, but with a focus on the needs of the enterprise. To that affect, we built in Scala (which runs on the JVM and provides easy integration with Java code), used David Pollack's super-scalable Lift framework and an actor-model designed by David, then we added features like message pools (which allow for groups of people to exchange non-public messages), the ability to post more than 140 characters, and the ability to follow not just people, but also tags and conversations.

Maybe that gives you the idea, maybe not. You can always go try it for yourself athttp://esmecloudserverapache.dickhirsch.staxapps.net/ or help out with the project - we can use help in many areas.

We've managed to do lots of other cool stuff in the context of ESME, but what I want to write a little bit about is what I think we still have ahead of us.

Distributed Twitter and federation

Talk of a non-centralized version of Twitter sprung up in earnest a couple of years ago with a post by Dave Winer, the inventor of RSS. The initial context was Twitter's regular downtime as it struggled with scaling, but the larger context quickly because the concern that we can't trust a single company to properly steward an enormous piece of communication infrastructure. The concern is basically about the Facebook-ification of Twitter. GigaOm has a prettydecent overview of the current state of the discussion.

From an enterprise perspective, this concern is even more motivated. Most enterprises still tend towards on-premise software by default and it is unclear if a messaging service is well-suited to a SaaS deployment option. Some companies, like Yammer (pure SaaS) and Status.net (open source - SaaS and on-premise options), are working on delivering a Twitter-like solution for the enterprise, but we aren't there yet.

Key requirements for a distributed Twitter service:

  1. Inter-operable Federation - Status.net has worked to introduce the OStatus standard, and this is an excellent start. However, the inter-operability of this protocol is relatively untested. I'd like to see if we can make this work for ESME, but it is going to take some additions to the protocol to manage pooled messages, for example.
  2. Follow any feed - Friendfeed had this capability, and ESME provides it in a bit of a different manner through our actions (though actions - Vassil's brainchild - do far more than this). I sometimes think of this capability as light-weight, or one-way, federation.
  3. Real-time updates from federated data source - Not only do we need to be able to follow feeds, we need to get updates from those feeds nearly instantly. PubSubHubbub (PuSH) is probably the most wide-spread solution here, and it is the solution that OStatus uses. But PuSH has weaknesses around authorization of subscriptions to private feeds, and here it would need to be rolled up with another standard like OAuth.
  4. Updates available as (protected) feeds.

Status.net seems to be the most on-the-ball with regards to these requirements, but there is a need for variety and for a tool like ESME that was built with business users in mind.

Real activities and objects as social objects

One important ability for an socially-oriented messaging system is that it makes business objects into first-class social objects. This is what John Tropea is getting at when he talks about the ability to follow conversations and tags. These objects should be first-class members of the messaging environment, supporting following and real-time updates.

We should also be able to integrate real business objects and business activities into the system as first-class objects. "I want to follow this customer", should be a desire that we support. Currently we offer a couple of ways to do this:

  1. Bring an activity into the ESME system as a message, either via the API or through an action that pulls an RSS feed. This message (or rather, the conversation around it) is a first-class messaging object in ESME, so if people want to see responses to an action, then they can follow the action. For example, I have actions set up onhttp://esmecloudserverapache.dickhirsch.staxapps.net/ that pull my new Twitter messages and newly created ESME Jira tickets in to my timeline.
  2. Bring an object into the ESME system as a tag, again using the API or an action. The tag then acts as the object that we can follow. We currently allow this as well, and it was used heavily by Sig Rinde in his prototype during his quite awesome prototype integration of the object-oriented business process engine (OOBPE?) Thingamy with ESME. But we could stand to have some more functionality for extracting tags and metadata from RSS feeds, allowing us to use this tag-as-object approach in a richer way.

We're currently thinking about ways to make our system more extensible and further enable the representation of business activities and objects as first-class objects in the messaging environment. We'd certainly like all the help we can get thinking about this topic.

Easier integration into other software products and environments

The capability that actions give us to pull in RSS and Atom feeds is really important. It means that ESME can integrate with systems that were not designed with ESME, or even social messaging in general, in mind. In turn, we need to improve our APIs to allow easier integration of ESME into other tools. Part of this involves doing things like providing RSS and Atom representations of timeline, probably via open standards like the Activity Streams standard.

On the somewhat more complex side, in will probably involve supporting other existing and emerging standards like allowing use of LDAP for authorization, LDAP groups for automatic pool creation, OpenSocial, PubSubHubbub for push-based feeds, using OAuth in our API, providing more semantic and linked information about data via our API, and supporting actions pulling Atom from OAuth-protected resources.

When I put it like that, it sounds like a lot, but it also sounds really exciting!

So, I'm sure I've missed a lot here, but these are just my thoughts about directions I'd like to see ESME move over the next few releases. Got ideas about where the project should go? We'd love to hear them :-)

What does SAP mean by "In-memory"?

It's been a bit more than 2 years since SAP introduced the "In Memory" marketing push, starting with Hasso Plattner's speech at Sapphire ... or was it TechEd ... my memory fails me ;-)

It has been two years and I have yet to see a good understanding emerge in the SAP community about what SAP actually means when it talks about "In Memory". I put the phrase "In Memory" into quotes, because I want to emphasize that it has a meaning entirely different from the standard English meaning of the two words "in" and "memory". This is a classic case, best summed up by a quote from one of the favorite movies of my childhood:

Vizzini: HE DIDN'T FALL? INCONCEIVABLE. Inigo Montoya: You keep using that word. I do not think it means what you think it means.

- IMDB

The only reasonably specific explanation of the "In Memory" term that I have seen from SAP is in this presentation by Thomas Zurek - on page 11.

If you want a coherent, official stance from SAP on "In Memory" and the impact of HANA on BW, I highly recommend reading and understanding this presentation. I think I can add a little more detail and ask some important questions, so here is my take:

Fact (I think...)

SAP is talking about at least 4 separate but complementary technologies when it says "In Memory":

1. Cache data in RAM

This is the easy one, and is what most people assume the phrase means. But as we will see below, this is only part of the story.

By itself, caching data in RAM is no big deal. Yes, with cheaper RAM and 64-bit servers, we can cache more data in RAM than ever before, but this doesn't give us persistence, nor does working on data in RAM guarantee a large speedup in processing for all data-structures. Often, more RAM is a very expensive way to achieve a very small performance gain.

2. Column-based storage 

Columnar storage has been around for a long time, but it was introduced to the SAP eco-system in the BWA (formerly BIA, now BAE under HANA - gotta respect the acronyms) product under the guise of "In Memory" technology. The introduction of a column-based data model for use in analytic applications was probably the single biggest performance win for BWA and followed in the footsteps of pioneering analytical databases like Sybase IQ, but it was largely ignored.

Interestingly, Sybase IQ is a disk-based database, and yet displays many of the same performance characteristics for analytical queries that BWA boasts. Further evidence that not all of BWA's magic is enabled by storing data in RAM.

3. Compression

So how do we fit all of that data in to RAM? Well, in the case of BWA the answer is that we don't - it stores a lot of data on disk and then caches as much as possible in RAM. But we can fit a lot more data into RAM if it is compressed. BWA, and HANA, implement compression algorithms to shrink data volume by up to 90% (or so we are told).

Compression and columnar storage go hand-in-hand for two reasons:

a. Column-based storage usually sorts columns by value, usually at the byte-code level. This results in similar values being close to each other, which happens to be a data layout that results in highly efficient compression using standard compression algorithms that make use of similarities in adjacent data. Wikipedia has the scoop here: http://en.wikipedia.org/wiki/Column-oriented_DBMS#Compression 

b. When queries are executed on a column-oriented store it is often possible to execute the query directly on the *compressed* data. That's right - for some types of queries on columnar-databases you don't need to decompress the data in order to retrieve the correct records. This is because knowledge of the compression scheme can be built into the query engine, so query values can be converted into their compressed equivalents. If you choose a compression scheme that maintains ordering of your keys (like Run Length Encoding), you can even do range queries on compressed data. This paper is a good discussion of some of the advantages of executing queries on compressed data: http://db.csail.mit.edu/projects/cstore/abadisigmod06.pdf

4. Move processing to the data

Lastly, the BWA and HANA systems make heavy use of the technique of moving processing closer to the data, rather than moving data to the processing. In essence, the idea is that it is very costly to move large volumes of data across a network from a database server to an application server. Instead, it is often more efficient to have the database server execute as much processing as possible and then send a smaller result set back to the application server for further processing. This processing trade-off has been known for a long time, but the move-processing-to-the-data approach was popularized relatively recently as a core principle of the Map-Reduce algorithm pioneered by Google: http://labs.google.com/papers/mapreduce.html 

This approach is especially useful when an analytical database server (which tends to have high data volumes) implements columnar-storage and parallelization with compression and heavy RAM-caching, so that it is capable of executing processing without becoming a bottle-neck.

Speculation

There are also a few technologies that I suspect SAP has rolled into HANA, but since they don't share the detailed technical architecture of the product, I don't know for sure.

1. Parallel query evaluation 

Parallel query execution (sometimes referred to as MPP, or massively-parallel-processing, which is a more generic term) involves breaking up, or sometimes duplicating, a dataset across more than one hardware node and then implementing a query execution engine that is highly aware of the data layout and is capable of splitting queries up across hardware. Often this results in more processing (because it turns one query into many, with an accompanying duplication of effort) but faster query response times (because each of the smaller sub-queries executes faster and in parallel). MPP is another concept that has been around for a long time but was popularized recently by the Map-Reduce paradigm. Several distributed DBMSes implement parallel query execution, including Vertica, Teradata, and hBase

2. Write-persistence-mechanism 

Since HANA is billed as ANSI SQL-compliant and ACID-compliant, it clearly delivers full write-persistence. What is not clear is what method is used to achieve fast and persistent writes along with a column-based data model. Does it use a write-ahead-log with recovery? Maybe a method involving a log combined with point-in-time snapshots? Some other method? Each approach has different trade-offs with regards to memory consumption and the ability to maintain performance under a sustained onslaught of write operations.

Conclusion

So, there are still a lot of questions about what exactly SAP means (or thinks it means) when it talks about "In Memory", but hopefully this helps to clarify the concept, and maybe prompt some more clarity from SAP about its technology innovations. There is no denying that BWA was and HANA will be a fairly innovative product, but for people using this technology it is important to get past the facade of an innovative black-box and understand the technologies underneath and how the approach applies to the business, data, or technical problem we are trying to solve.

Elastic lists using Protovis

I've been seeing more and more list-based visualizations used for data selection showing up in BI software. These types of selection interfaces are especially prominent in Qlikview and SAP BusinessObjects Explorer (which you can try on theweb).

Ever since seeing Moritz Stefaner's implementation of Elastic Lists, I've been a bit dissatisfied with the implementations in enterprise BI tools, including the ones listed above. "Elastic" lists leverage the list format to visualize characteristics of the data by tying the size of the bar representing a column value in the selection list to a metadata metric - in this case the probability that a given column value will occur in a dataset.

In order to help myself understand the strengths and weaknesses of this type of visualization more thoroughly, I started to experiment with list-based visualizations in Protovis (a Javascript-based visualization library using SVG for rendering). Eventually, I added in elasticity and gave the list selection the power to drive a second visualization. It uses the cars dataset and visualization from the Protovis examples to demonstrate driving a second visualization with the list selection. (Note: the coordinates on the second visualization are reversed for reasons that I haven't looked into at the moment.)

That experiment is now working well enough that I thought I'd publish it so that others can comment, use the code (but really, it's a bit of a mess, so be wary), and experiment with the concept. If you want to add some capability, go right ahead and fork the project on Github.

For my part, I will likely do a more thorough analysis of list-based visualization in BI tools eventually, but for now I think I can safely say that anywhere a list appears, there is little excuse for lack of "elasticity" in the visualization.

Note: This visualization will only work in browsers that support the SVG standard. It does not work in IE6, 7, or 8. Pretty much any other browser (Firefox, Chrome, Safari, etc.) should work fine.

You can view a static image of the visualization below.